What 167 new top-grossing apps do differently
A study of the US App Store’s top 1,000 earning apps
Key findings
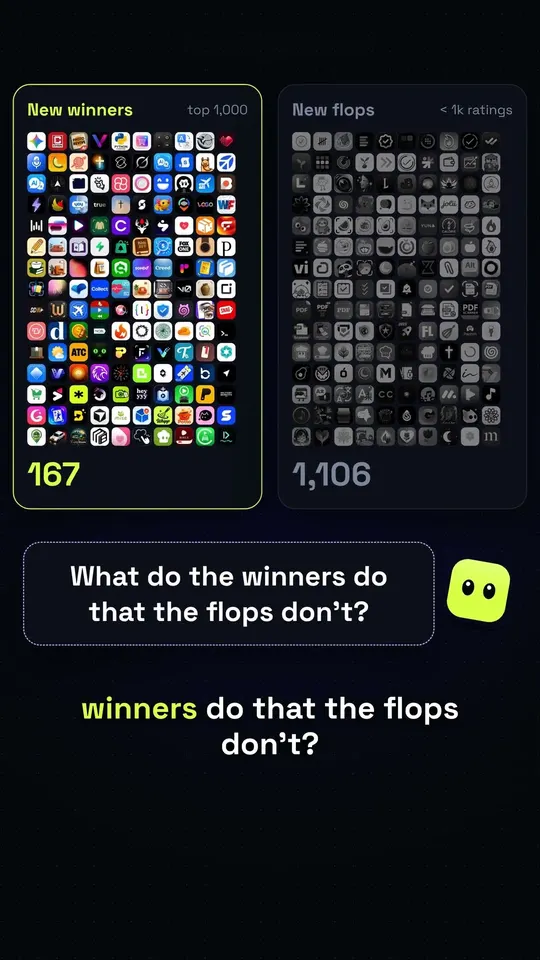
- 167 of the 1,000 top-grossing apps (about 1 in 6) launched less than two years ago, even though the typical top earner is 7.6 years old.
- New winners were last updated a median of 7 days ago. New apps that didn’t take off: 76 days.
- 60.5% of new winners mention a subscription, against 39% of new flops. Only 0.9% of the top 1,000 charge to download.
- Neither AI nor translation is the entry ticket: 64% of new winners never mention AI, and 51.5% are English-only.
 Watch the 60-second versionYouTube Short
The two groups we compare
Old giants make any chart look the same: they update often because they have big teams. So most of this study compares only young apps with each other.
Top-1,000 apps that launched less than 2 years ago. Median age: 1 year.
Apps 6–24 months old that show up in common searches but are on no top-grossing chart and have fewer than 1,000 ratings.
How old are the top-earning apps?
Most of them are old. The median top-1,000 app is 7.6 years old, and the oldest launched in 2008, the year the App Store opened. But the door is open: 167 apps, about 1 in 6, launched less than two years ago. More of today’s top earners launched in 2025 than in any other year.
What it means for your app: You don’t need a ten-year head start. New apps do get in. The rest of this study looks at what those 167 apps have in common.
How often do new winners update?
This is the clearest gap between the two groups. New winners were last updated a median of 7 days ago. New flops: 76 days, roughly 11 times longer. 86% of new winners shipped an update in the last 30 days, against 36% of new flops. On this, new winners behave just like the giants: the whole top 1,000 also sits at a median of 7 days.
A fair warning: this is a pattern, not proof. Frequent updates may help an app win, or an app that already earns may simply be able to pay for more updates. Probably both.
What it means for your app: Ship small updates on a steady rhythm and say what changed in the release notes. An app last touched months ago looks abandoned next to rivals that updated last week.
Do you need translations to break in?
No. 51.5% of new winners list English as their only store language, and their median is 1 language. To be fair, translation doesn’t separate the two young groups either: new flops are even more often English-only (57%). The real gap comes with age. Winners older than two years list a median of 7 languages, and the whole top 1,000 lists 6. Translation tends to come after traction, not before.
What it means for your app: Launch in the language of your first market. Translate when downloads from a country show up on their own, not as a launch task.
How do new winners make money?
With subscriptions. 60.5% of new winners mention a subscription in their description, against 39% of new flops. Free trials point the same way: 20.4% against 13.3%. Almost nobody charges to download: only 0.9% of the top 1,000 have a price tag, against 3.2% of the search comparison group. Among new apps, paid downloads are rare in both groups (1.2% and 0.7%), so the real difference is the subscription, not “not charging up front”.
What it means for your app: A free download with a clear subscription is the model that tops the charts. Say plainly in your listing what the subscription unlocks and whether there is a free trial.
Do new winners sell themselves as AI apps?
Mostly, no. 64% of new winners never mention AI in their name or the opening of their description. They describe the job instead: plan meals, track packages, find cheap flights. The honest part: new flops mention AI slightly less often (29% against 36%). So the word “AI” neither makes nor breaks entry on its own.
New winners that never mention AI
 mise - meal planner#3 in Food & Drink · 5 months old
 Scroll The Bible#4 in Book · 10 months old
 TapCook: Budget Meal Plans#4 in Food & Drink · 3 months old
 Localize - Farmers Market#5 in Food & Drink · 10 months old
 Package Tracker - TrackPack#5 in Shopping · 4 months old
 Airclub - Flight Deals#7 in Travel · 20 months old
Best top-grossing rank within the app’s own category, and age, on 30 October 2026.
What it means for your app: Lead with the job your app does for people. Mention AI where it helps explain how, not as the headline.
What doesn’t make a difference?
Some things people obsess over look the same in both young groups.
Median stars, new winners vs new flops. The flops even score a bit higher: a handful of ratings swings easily.
Median number of iPhone screenshots. Same in both groups.
A huge gap, but it’s a result of success, not a lever. More users leave more ratings.
We only counted screenshots. What they show and say (and the subtitle) is not in Apple’s public data, so this study can’t judge them.
What it means for your app: Don’t spend launch month chasing a perfect star average or a tenth screenshot. Put that time into updates and a clear offer.
Where are new apps breaking in?
We read through all 167 new winners. These are the themes that keep coming back, with a few real examples each.
- Scan it, learn what it’s worth, resell itThrift finds, antiques, trading cards.e.g. ThriftAI, AntiqSnap, Value Scout, Cardly
- Meal planning and recipesPlan the week, shop on a budget.e.g. mise, TapCook, Whipp, NeatEat
- AI images, video and home designHere AI is the product itself.e.g. Kling, ReShoot, House AI, AI Decor
- Short drama and interactive storiesPaid episodes in vertical video.e.g. StoryReel, VibeShort, BlinkDrama
- Faith and the BibleDaily reading, widgets, short videos.e.g. Scroll The Bible, Bible Widgets, Bible Shorts
- Apps that find you moneySettlements, refunds, forgotten subscriptions.e.g. Settlemate, ClaimHunt, Subpilot, JetBack
- Phone clients for developer toolsA small category, so the bar is low: some made the top 40 with only a few dozen ratings.e.g. Supanator (Supabase), Clouder (Cloudflare), Netli.fyi, Termiux
- Flight deals and trackingCheap fares, live flight info.e.g. Airclub, TripDeals, FlightSky
What it means for your app: Look for a job people will pay to get done, ideally in a category where the top 40 isn’t all decade-old giants. Smaller categories have a lower bar. See all 167 new winners grouped by idea →
How does this compare with other data?
Our numbers come from public chart positions. RevenueCat’s yearly report uses real revenue from the apps on its platform, worldwide. Different data, but it points the same way.
“…monthly new subscription app launches increased from ~2,000 in January 2022 to 14,700+ by January 2026 (likely driven by the AI app explosion), yet apps launched before 2020 still generate 69% of all subscription revenue.”
Fits our 7.6-year median age: old apps hold most of the money, while a steady stream of new ones fight for the rest.
“RevenueCat data shows a median of 10.7% for apps with hard paywalls versus 2.1% in freemium apps.”
A hard paywall is still a free download with a subscription inside, which matches what we see: only 0.9% of top earners charge for the download itself.
“AI-powered apps account for 27.1% of apps across all categories… people canceling their annual subscriptions — a metric known as churn — 30% faster than non-AI apps, at the median.”
Fits our AI finding: AI can sell, but most new winners (64%) win without leading with it.
Method and limits
What we collected
- Store and date: US App Store, iPhone apps, games excluded, collected on 30 Oct 2026.
- The top 1,000: the top-grossing chart of each of 23 categories from Apple’s iTunes RSS feed (
https://itunes.apple.com/us/rss/topgrossingapplications/limit=100/genre=<id>/json), taking about the top 43 apps of each category, 1,000 apps in total. App details come from theitunes.apple.com/lookupAPI. - The search comparison group: 6,241 apps that appear for 40 common searches (habit tracker, budget, VPN, meal planner and so on) in the iTunes Search API but are on none of the top-grossing lists.
Definitions
- New winners
- Top-1,000 apps first released less than 2 years before collection (167 apps).
- New flops
- Comparison-group apps aged 6–24 months with fewer than 1,000 ratings (1,106 apps).
- Mentions a subscription / free trial
- The words “subscription”, “subscribe” or “auto-renew” (or “free trial”, “try it free”) appear in the store description.
- Mentions AI
- “AI”, “artificial intelligence” or “GPT” appears in the app name or the first 600 characters of the description.
- Languages / English-only
- The languages the App Store lists for the app; English-only means English is the only one.
- Paid download
- A store price above $0.
- Days since update
- Days between the current version’s release date and the collection date. We report medians, not averages, so a few extreme apps don’t skew the picture.
What this data can’t tell you
- Chart rank is not revenue. Apple doesn’t publish earnings, and categories differ hugely in money: #20 in Developer Tools is not #20 in Finance.
- Patterns, not causes. Winners may update often because they can afford to.
- One country (US) and one day (30 October 2026). Charts move daily.
- Listing text is not the product. An app can use AI without saying so, or offer a subscription without the word in its description.
- Screenshot content and subtitles were not analysed.
- The comparison group comes from 40 searches, so its category mix is not the same as the top 1,000.
All 1,000 apps with category, best category rank, age, days since update, ratings, stars, languages, screenshots, price and the subscription, trial and AI flags.
Licence: CC BY 4.0 — free to use, please credit Just Ship Studio with a link to this page.
FAQ
Where does the data come from?
Only from Apple’s public endpoints: the iTunes top-grossing RSS charts, the iTunes Lookup API and the iTunes Search API. US storefront, iPhone apps, games excluded, collected on 30 Oct 2026. No pages were scraped and no paid data was used.
Does updating more often make an app earn more?
This data can’t prove that. It shows that new apps on the top-grossing charts update far more often than new apps that didn’t take off. It could also work the other way: an app that earns can afford to ship more updates.
Can a new app still reach the top-grossing charts?
Yes. 167 of the 1,000 apps in this study (about 1 in 6) launched less than two years before the data was collected, even though the median top earner is 7.6 years old.
Do I need to translate my app before launch?
The data says it isn’t required to break in: 51.5% of new winners list English as their only language. Older top earners list a median of 7 languages, so translation tends to come after traction.
Can I use this data?
Yes. The full list of 1,000 apps is a free CSV download under the Creative Commons Attribution 4.0 licence (CC BY 4.0). Use it for anything; just credit Just Ship Studio and link to this page.
Does your app follow these patterns?
Check your listing with our free App Store Page Grader. It looks at your last update, languages, screenshots, ratings and more, next to your real rivals. No sign-up.
Grade my App Store page →